
Have you ever felt frustrated while debugging PHP code? I can feel your pain, in this blog I will explain how to set up and debug PHP code using Xdebug in under 5 minutes. Though PHP is outdated still many companies maintain PHP code. If you’re one among them, then setting up Xdebug will save you time.
What is Xdebug?
Xdebug is a PHP extension that provides debugging and profiling capabilities. It uses the DBGp debugging protocol.
Features of Xdebug
- Step Debugging — A way to step through your code in your IDE or editor while the script is executing.
- Improvements to PHP’s error reporting — An improved
var_dump()function, stack traces for Notices, Warnings, Errors, and Exceptions to highlight the code path to the error - Profiling — Allows you, with the help of visualization tools, to analyze the performance of your PHP application and find bottlenecks.
Steps to download and configure Xdebug
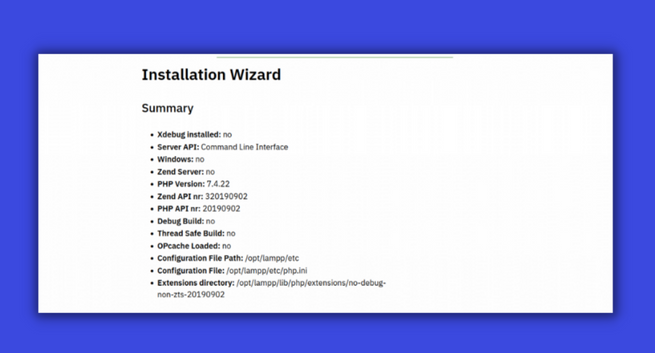
- Install Xdebug – Execute
php -icommand and copy-paste the output into the Xdebug installation wizard and click Analyse my phpinfo() output button.
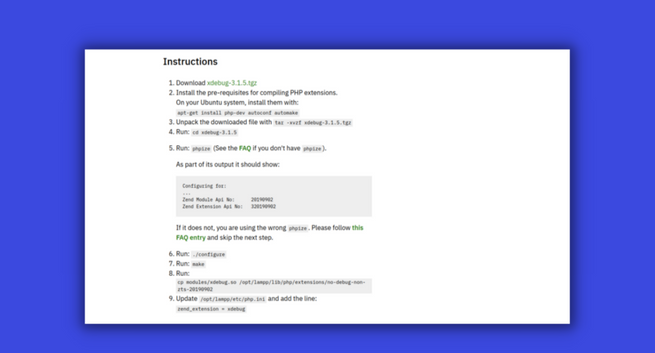
php -i 2. Xdebug installation wizard will give you the below output. It says Xdebug Installed: no, which means that Xdebug is not installed. Download and install Xdebug by following the steps given in the wizard
Note: Kindly make note of the path, where you have downloaded and installed Xdebug.

3. Configure PHP to use Xdebug — You need to say PHP to use Xdebug. You can do that by adding this zend_extension=path/to/xdebug at end of your php.ini file.
Note : say you have downloaded Xdebug in ~/Downloads directory then Xdebug path will be /home/{your-desktop-name}/Downloads/xdebug-3.1.4/modules/xdebug.so
#php.ini
zend_extension=path/to/xdebug
4. How to find the path of php.ini file — You can find the path of your php.ini in your php -i output under “Loaded Configuration File” or execute the below command
php -i | grep 'Configuration File' // php.ini file location 5. Enable remote debugging in your php.ini:
For Xdebug v3.x.x:
xdebug.mode = debug
xdebug.start_with_request = ye
For Xdebug v2.x.x:
xdebug.remote_enable = 1
xdebug.remote_autostart = 1
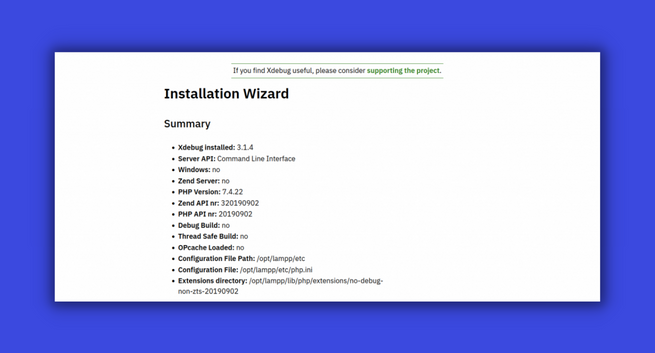
xdebug.remote_port = 9000 6. Tada 🎉! you installed Xdebug successfully. To verify the installation, check the output of php -i Xdebug section.
Configure Xdebug in VS code
- In VS code extensions marketplace search for PHP debug and install the extension
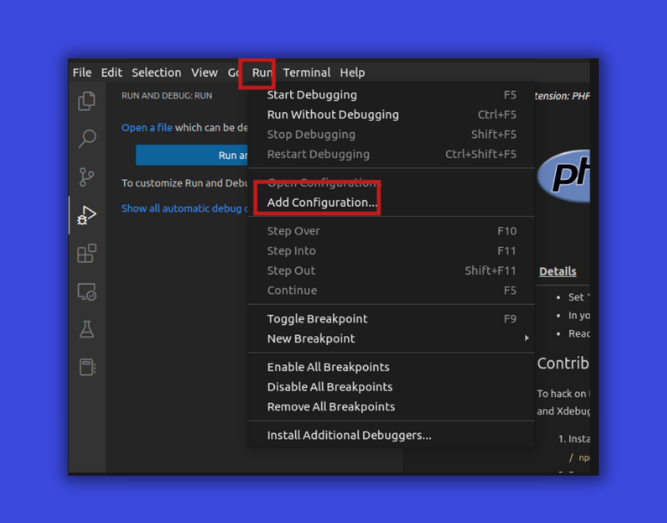
- Click on the Run menu at the top, select Add Configuration and select PHP. A file called launch.json will be created

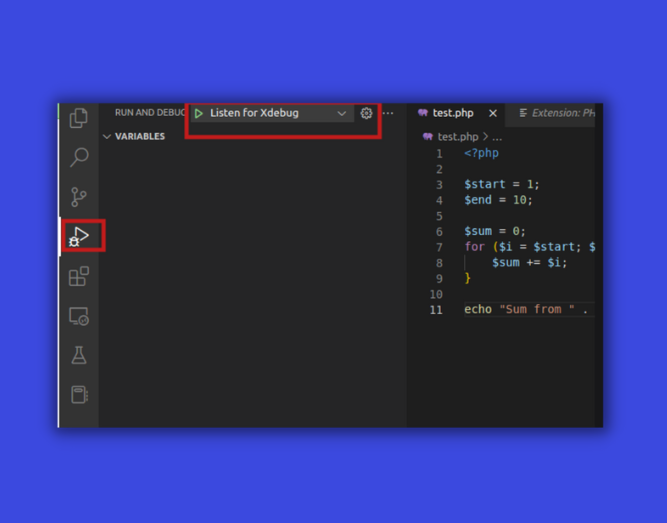
- Now click debugger in the sidebar and click Listen for Xdebug
- Now place the breakpoint in your PHP file and run it

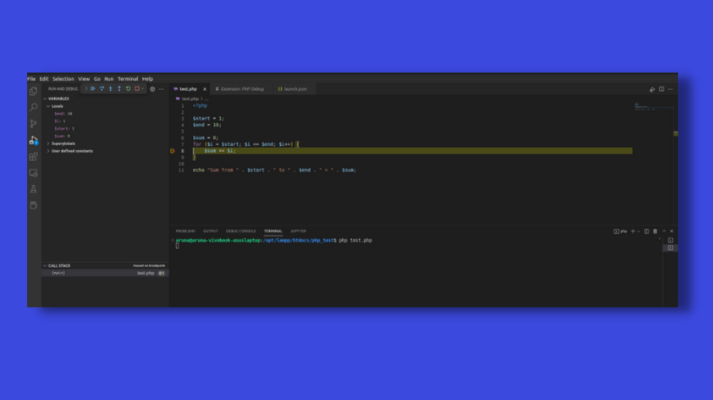
That’s all you successfully configured Xdebug in VScode 🔥 . Hope you enjoyed the article. Subscribe to our Newsletter for more articles like this!