Have you ever felt frustrated while debugging PHP code? I can feel your pain, in this blog I will explain how to set up and debug PHP code using Xdebug in under 5 minutes. Though PHP is outdated still many companies maintain PHP code. If you’re one among them, then setting up Xdebug will save you time.
Table of Contents
What is Xdebug?
Xdebug is a PHP extension that provides debugging and profiling capabilities. It uses the DBGp debugging protocol.
Features of Xdebug
- Step Debugging — A way to step through your code in your IDE or editor while the script is executing.
- Improvements to PHP’s error reporting — An improved
var_dump()function, stack traces for Notices, Warnings, Errors, and Exceptions to highlight the code path to the error - Profiling — Allows you, with the help of visualization tools, to analyze the performance of your PHP application and find bottlenecks.
Steps to download and configure Xdebug
- Install Xdebug – Execute
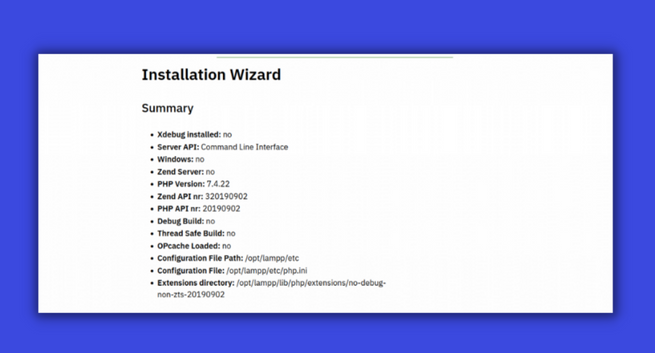
php -icommand and copy-paste the output into the Xdebug installation wizard and click Analyse my phpinfo() output button.
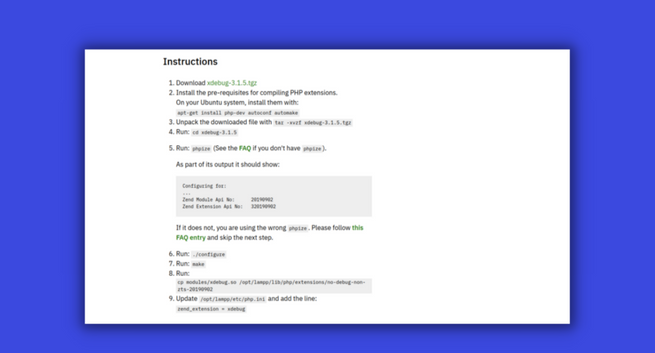
php -i 2. Xdebug installation wizard will give you the below output. It says Xdebug Installed: no, which means that Xdebug is not installed. Download and install Xdebug by following the steps given in the wizard
Note: Kindly make note of the path, where you have downloaded and installed Xdebug.
3. Configure PHP to use Xdebug — You need to say PHP to use Xdebug. You can do that by adding this zend_extension=path/to/xdebug at end of your php.ini file.
Note : say you have downloaded Xdebug in ~/Downloads directory then Xdebug path will be /home/{your-desktop-name}/Downloads/xdebug-3.1.4/modules/xdebug.so
#php.ini
zend_extension=path/to/xdebug
4. How to find the path of php.ini file — You can find the path of your php.ini in your php -i output under “Loaded Configuration File” or execute the below command
php -i | grep 'Configuration File' // php.ini file location 5. Enable remote debugging in your php.ini:
For Xdebug v3.x.x:
xdebug.mode = debug
xdebug.start_with_request = ye
For Xdebug v2.x.x:
xdebug.remote_enable = 1
xdebug.remote_autostart = 1
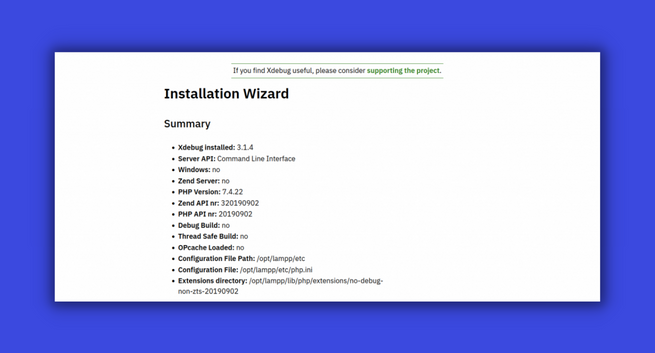
xdebug.remote_port = 9000 6. Tada 🎉! you installed Xdebug successfully. To verify the installation, check the output of php -i Xdebug section.
Configure Xdebug in VS code
- In VS code extensions marketplace search for PHP debug and install the extension
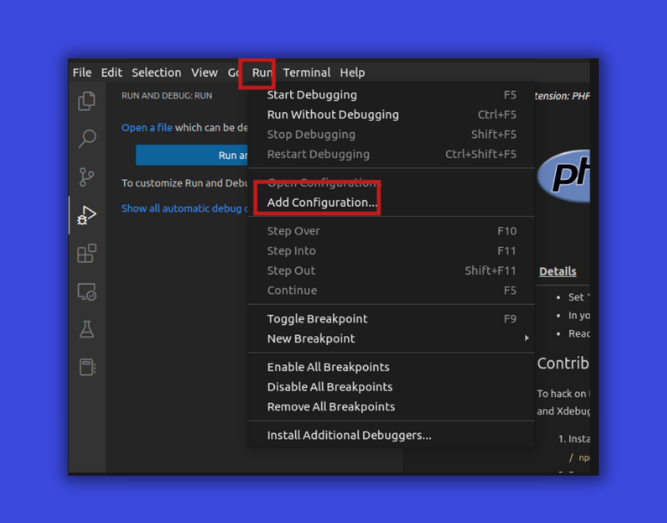
- Click on the Run menu at the top, select Add Configuration and select PHP. A file called launch.json will be created
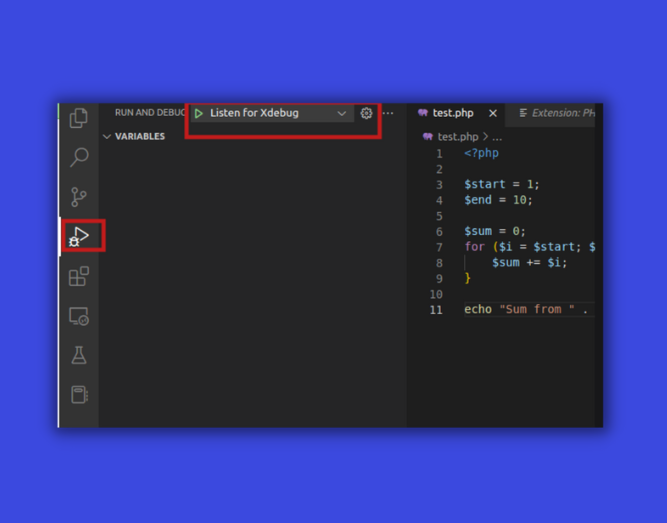
- Now click debugger in the sidebar and click Listen for Xdebug
- Now place the breakpoint in your PHP file and run it
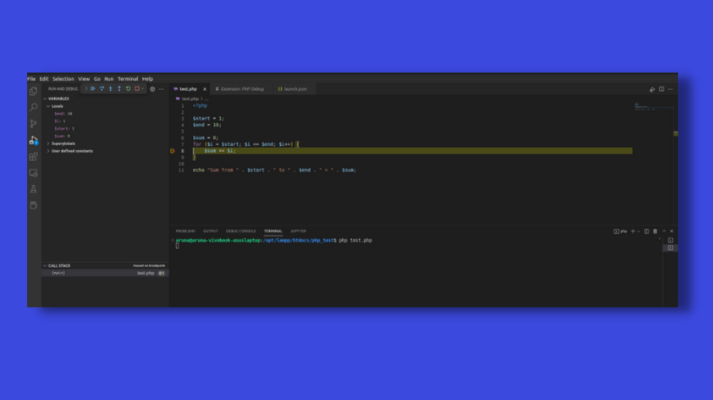
That’s all you successfully configured Xdebug in VScode 🔥 . Hope you enjoyed the article. Subscribe to our Newsletter for more articles like this!